


If your team is running staging environments, CI/CD pipelines, or Docker-based development workflows in the cloud, you already know how fast the bills add up. A handful of staging VMs on AWS or Azure can easily run you €500-1,000/month — and that’s before egress charges hit every time someone pushes an image or pulls a dependency.
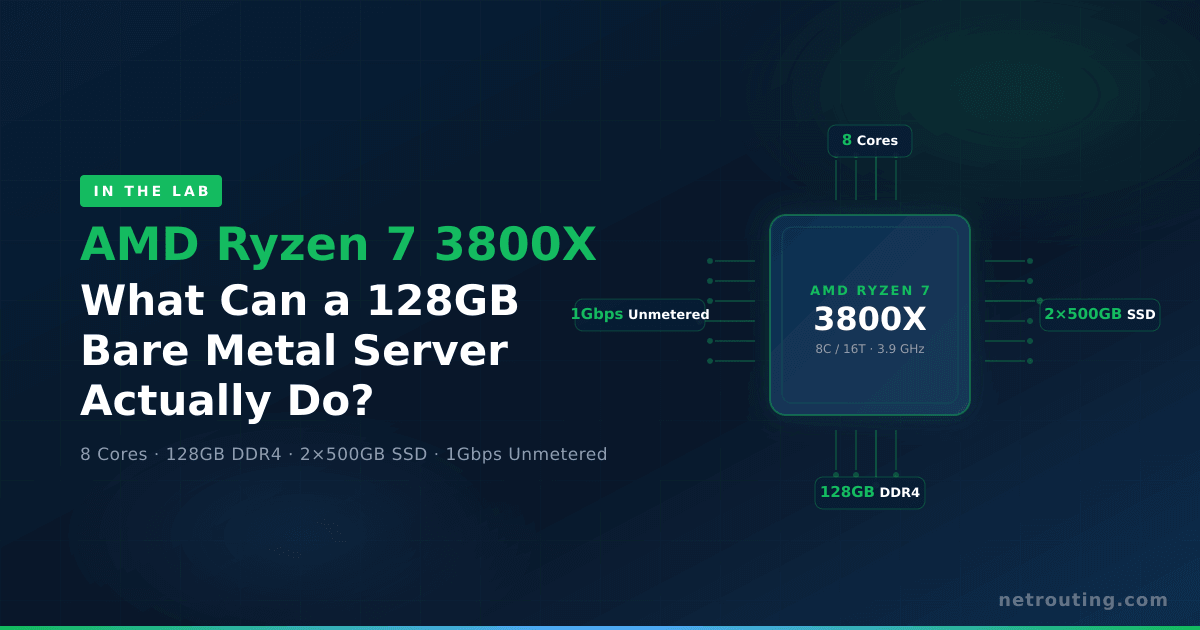
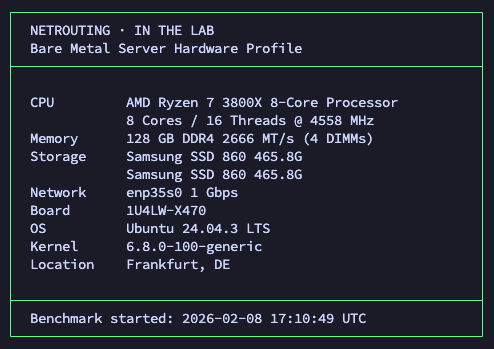
We wanted to find out exactly what a single, well-specced bare metal server can do when you throw real development workloads at it. So we took one of our AMD Ryzen 7 3800X configurations — 8 cores, 128GB of DDR4, dual SSDs, and a full gigabit of unmetered bandwidth — set it up on a clean Ubuntu install at our Frankfurt data center, and ran it through a gauntlet of the workloads that DevOps engineers and platform teams actually care about: PostgreSQL databases, Redis caches, Docker staging stacks, CI/CD builds, and web serving.
No cherry-picked numbers. No synthetic fluff. Just real tools producing real results.
This is the first entry in our “In The Lab” series, where we put our hardware through its paces so you know exactly what you’re getting before you order.
The Hardware
8 Cores / 16 Threads @ 3.9 GHz
DDR4 UDIMM
SSD (SATA/NVMe)
Dedicated & Unmetered
This is a Zen 2 chip — not the latest generation, and that’s the point. It’s mature silicon at a price that makes sense for 24/7 infrastructure. The 3800X still holds its own with 4.5 GHz boost clocks and solid IPC. Pair that with 128GB of RAM (more than most cloud VMs you’ll find at twice the price), unmetered gigabit connectivity, and complimentary DDoS protection, and you’ve got a machine that punches well above its monthly cost.
Available in Frankfurt, Amsterdam, and Miami — pick the location closest to your team or your users.
CPU Performance: The Foundation
Before we get to the workloads, here’s the baseline. We ran both sysbench and Geekbench 6 to give you reference points you can compare against cloud instances and other hardware.
| Test | Result | What It Means |
|---|---|---|
| Sysbench Single-Thread | 821 events/sec | Database queries, single-process tools |
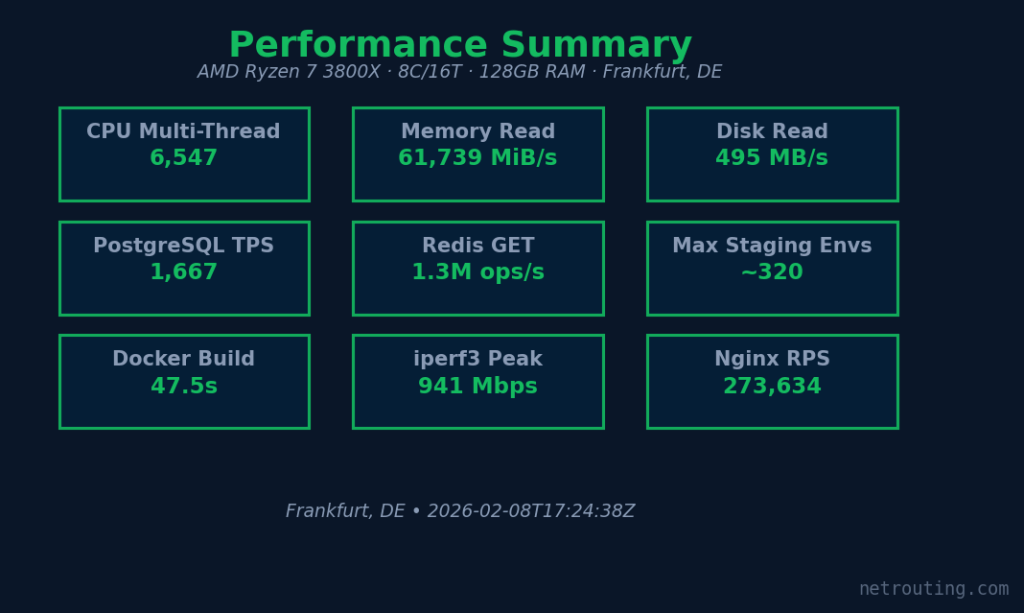
| Sysbench Multi-Thread (16T) | 6,547 events/sec | Compilation, Docker builds, parallel CI jobs |
| Geekbench 6 Single-Core | 1,673 | Industry-standard reference (full results) |
| Geekbench 6 Multi-Core | 8,584 | Industry-standard reference (full results) |
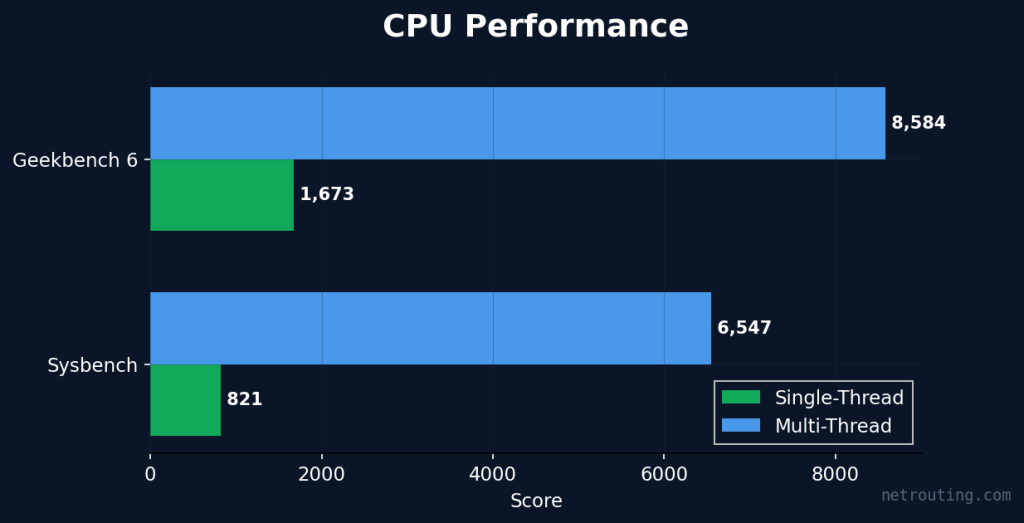
8 cores / 16 threads give you the headroom to run multiple services side by side without contention — a database, a cache layer, a web server, and a couple of CI runners can all coexist comfortably.
Storage: How Fast Can It Move Data?
Storage performance matters for everything from database commits to Docker layer builds. We ran fio with a mix of sequential and random I/O patterns to simulate real workloads.
| Test | Result |
|---|---|
| Sequential Read (1M blocks) | 495 MB/s |
| Sequential Write (1M blocks) | 330 MB/s |
| Random 4K Read (IOPS) | 144,328 IOPS |
| Random 4K Write (IOPS) | 77,077 IOPS |
| Mixed 70/30 R/W | R: 65,963 / W: 28,333 IOPS |
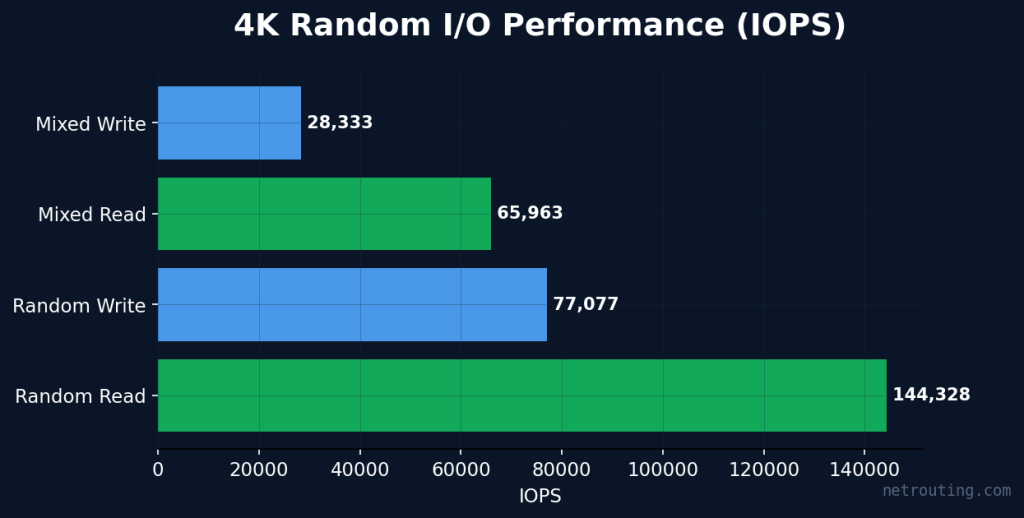
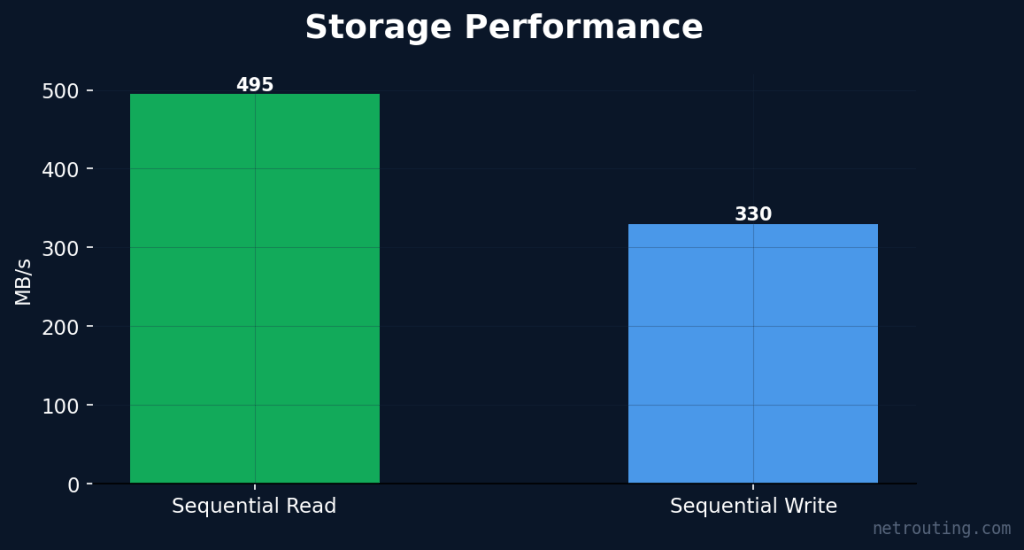
With two SSDs in the chassis, you’ve got the option to configure RAID-1 (like we did for our test) for redundancy or keep them separate for OS/data isolation. For database-heavy workloads, the random IOPS numbers are what matter most — and they’re solid.
Network: Frankfurt at the Heart of Europe
This server sits in our Frankfurt data center — one of the most connected cities in Europe. But specs on paper don’t tell you what latency your users, team members, or CI pipelines will actually experience. We pinged the infrastructure of major European ISPs to find out.
Latency to European ISPs
| Provider | Country | Latency (avg) |
|---|---|---|
| Deutsche Telekom | Germany | 0.61 ms |
| Vodafone Deutschland | Germany | 1.13 ms |
| 1&1 IONOS | Germany | 4.52 ms |
| KPN | Netherlands | 6.66 ms |
| Proximus | Belgium | 12.39 ms |
| Swisscom | Switzerland | 5.44 ms |
| A1 Telekom | Austria | 11.38 ms |
| Orange | France | 12.11 ms |
| Telefónica | Spain | 32.68 ms |
| COSMOTE | Greece | 43.75 ms |
| Fastweb | Italy | 21.89 ms |
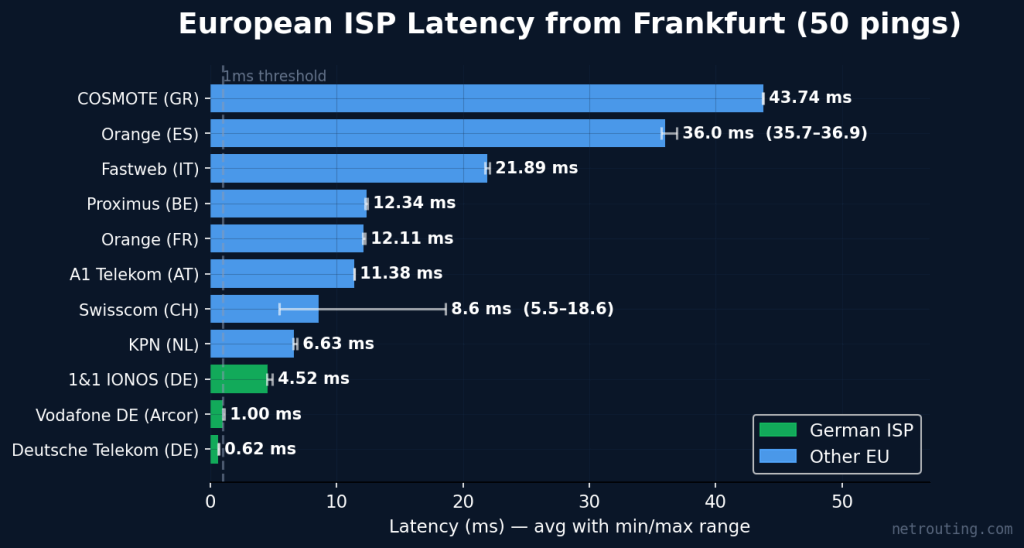
Sub-millisecond to Deutsche Telekom, single-digit across DACH, and under 45ms to Southern Europe — your staging environments feel responsive to distributed teams across the continent, from Amsterdam to Athens. CI webhooks fire fast, API staging endpoints respond like production, and even developers in Madrid or Milan get a smooth experience.
Throughput to European Mirrors
Latency is half the story — what about raw bandwidth? We ran iperf3 against mirrors in Frankfurt and Amsterdam to verify the 1Gbps link delivers at line rate.
| Test | Throughput |
|---|---|
| iperf3 → Frankfurt (Leaseweb) | 941 Mbps |
| iperf3 → Amsterdam (Worldstream) | 938 Mbps |
The link saturates to mirrors across Western Europe. Whether you’re pulling Docker images, cloning repos, or syncing database backups, you’re getting the full gigabit you’re paying for.
Why “Unmetered” Changes the Economics
Cloud providers charge per GB of egress. Pull a Docker image? That’s egress. Push build artifacts to a registry? Egress. Sync a 50GB database backup? You guessed it — egress. On a busy development team, those charges can silently add €100-200/month to your cloud bill. At Netrouting, unmetered means unmetered. Push and pull at line rate, 24/7, and you’ll never see an overage fee. That’s a big deal for teams running CI/CD pipelines that move gigabytes of images and artifacts every day.
PostgreSQL: Real Database Performance
If you’re running staging environments, you need databases. We installed PostgreSQL and ran pgbench with progressively heavier workloads to see how the server handles real OLTP patterns.
| Test Scenario | Clients | Result (TPS) | What It Simulates |
|---|---|---|---|
| Read-only (SELECT) | 10 | 149,926 TPS | Cache lookups, API read endpoints |
| Read-write (OLTP) | 10 | 1,667 TPS | Typical app workload |
| Heavy concurrent | 50 | 3,063 TPS | Connection pool stress |
| Burst (max load) | 100 | 3,484 TPS | Peak traffic simulation |
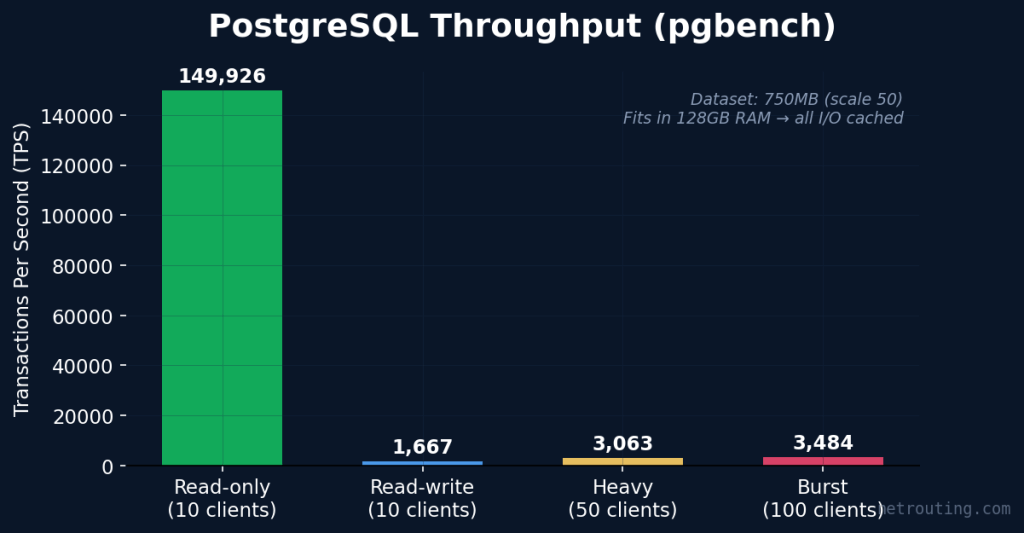
The ~750MB test dataset (pgbench scale 50) fits entirely in 128GB of RAM, which means all I/O is cached — exactly what happens in practice when your staging databases are comfortably smaller than your available memory. With this kind of throughput, you can run multiple staging databases on the same server without them stepping on each other.
Redis: In-Memory Speed for Your Cache Layer
Every modern application stack needs a cache. Redis handles session storage, API response caching, job queues, and real-time pub/sub. Here’s how it performs on this hardware with pipelined operations (which is how your application will actually use it).
| Operation | Throughput | Use Case |
|---|---|---|
| SET (1M ops, pipeline 16) | 1.1M ops/sec | Bulk writes, session storage |
| GET (1M ops, pipeline 16) | 1.3M ops/sec | Cache reads, API response cache |
| LPUSH (500K ops, pipeline 16) | 1.1M ops/sec | Job queues, message queues |
| LRANGE 100 (100K ops) | 69K ops/sec | Leaderboards, feed pagination |
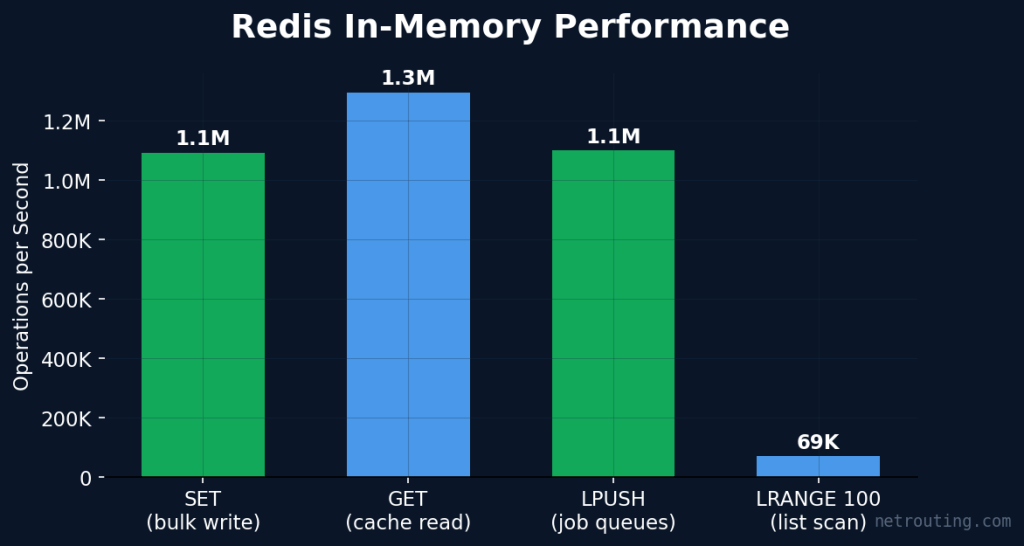
With 128GB of RAM, Redis can cache enormous datasets. Your staging environments won’t need to compromise on cache size the way they do on a 4GB cloud VM — you can mirror production-scale cache behavior in staging, which means fewer surprises when you deploy.
Docker Staging Stacks: How Many Environments Can You Run?
This is the headline number for anyone considering this server for development infrastructure. We deployed a full SaaS staging stack — PostgreSQL, Redis, and Nginx in containers — measured the idle footprint, then estimated realistic capacity accounting for working memory (shared_buffers, cache data, active connections).
| Metric | Result |
|---|---|
| Stack startup time | 1275 ms |
| Memory per stack (with working data) | ~384 MiB |
| Available RAM (after OS + Docker) | ~120 GB |
| Estimated staging environments | ~320 |
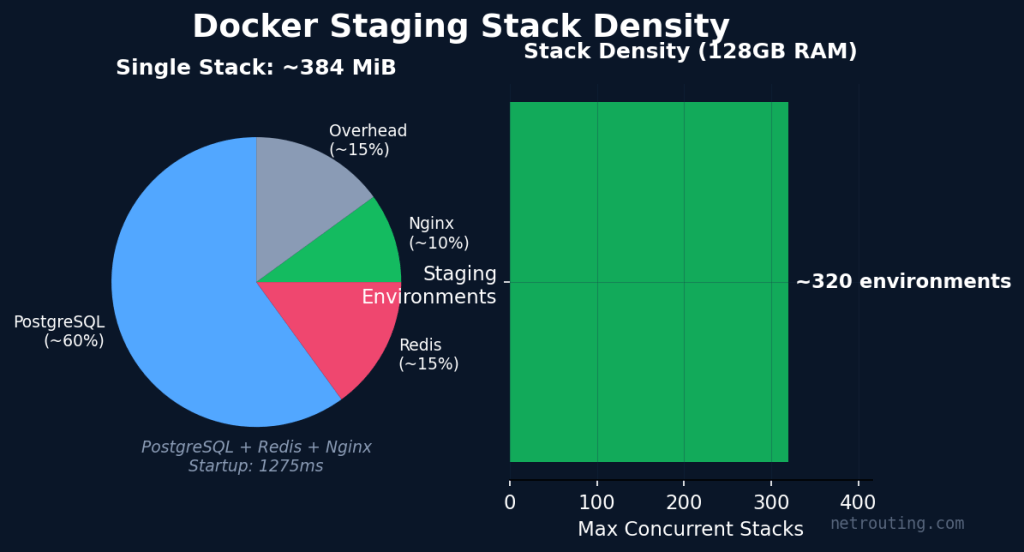
Each environment gets its own isolated database, cache layer, and web server — zero contention between branches, pull requests, or team members. Spin up a new environment per feature branch and tear it down when the PR merges. Your actual count will depend on how much data each environment holds, but even at half the estimate you’re running far more environments than any comparably priced cloud setup.
The Math: Bare Metal vs. Cloud Staging
A typical 3-container staging stack on AWS (RDS micro + ElastiCache micro + ECS task) runs about €80-120/month per environment. A team of 10 developers each running their own staging environment would pay €800-1,200/month in the cloud. On this server, those same 10 environments cost you a share of the €129/month flat rate — €12.9 per environment, with capacity to spare for CI runners, shared databases, and caches. Scale to 20-30 environments and you’re still under €129/month total.
CI/CD Build Performance: Ship Faster
Fast feedback loops make developers productive. We tested three real-world CI/CD operations to see how this server performs as a self-hosted build machine.
| Operation | Result | Context |
|---|---|---|
| Docker image build | 47.5s | Node.js app with 15 real npm dependencies |
| Compilation throughput | 50K bogo-ops/sec | All 16 threads, sustained 30s |
| Git clone (shallow) | 0.5s | Via 1Gbps unmetered connection |
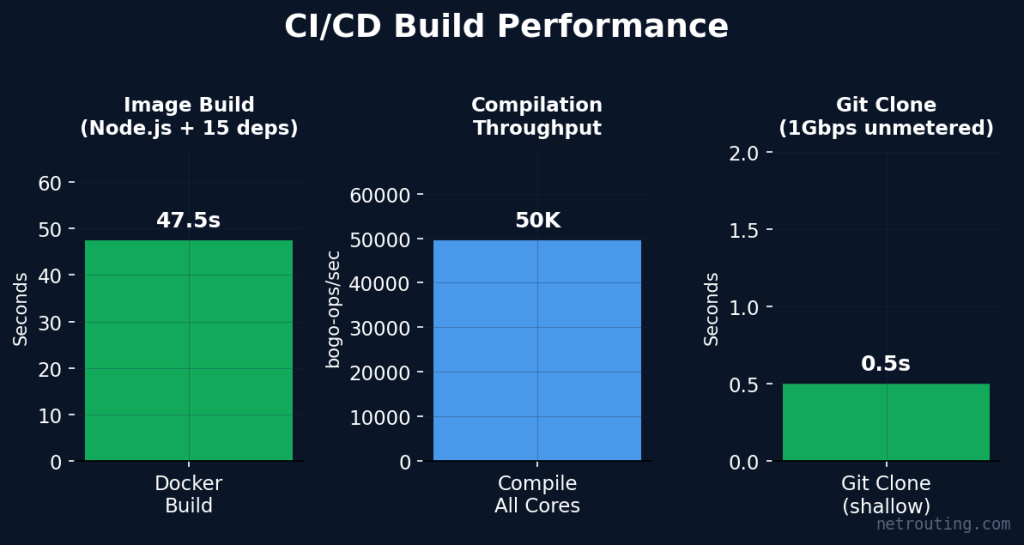
With 8 cores and 128GB of RAM, you can run multiple CI runners in parallel — think 3-4 concurrent builds without breaking a sweat. And because the bandwidth is unmetered, pulling base images, downloading dependencies, and pushing artifacts to your registry never costs you a penny in transfer fees.
Self-Hosted GitHub Actions, GitLab CI, or Jenkins
This server is an ideal host for self-hosted CI runners. GitHub Actions runners, GitLab CI executors, and Jenkins agents all run beautifully on bare metal with this much RAM and CPU available. You get full control over the build environment, no shared runner queues, and predictable performance — all for a flat monthly rate with no per-minute billing.
Web Serving: Nginx Out of the Box
Whether you’re serving staging sites, acting as a reverse proxy for your Docker containers, or hosting production web applications, this server handles web traffic with ease. We tested Nginx using wrk with 50 concurrent connections sustained for 30 seconds, serving a realistic 12KB staging dashboard page via the server’s public IP.
| Metric | Result |
|---|---|
| Throughput (50 connections, 30s) | 273,634 req/sec |
| Average Latency | 0.1ms |
These numbers reflect server-side processing capacity with traffic routed through the real network interface — not a loopback shortcut. Actual end-user throughput will depend on client latency and connection quality, but the hardware has headroom to spare for reverse proxying, static assets, and TLS termination.
Why Netrouting? What You Get Beyond the Hardware
Plenty of providers can sell you a Ryzen 3800X. Here’s what you get when you buy it from us.
DDoS Shield — Complimentary on Every Server
Every Netrouting bare metal server ships with our DDoS Shield protection at no extra cost. No add-ons, no premium tiers, no surprise invoices when an attack hits. Your development infrastructure stays online and your team stays productive.
24/7 Expert Support
Real humans, not chatbots. Our team provides around-the-clock assistance with a guaranteed 1-hour ticket response time. Network issues, hardware questions, OS configuration — we’ve got you covered.
One-Click OS Deploy
Provision your server with your choice of operating system through our control panel — or bring your own custom ISO via virtual media. Ubuntu, Debian, CentOS, Windows Server, or anything else you need.
Enterprise-Grade Hardware
Every server runs on components rated for continuous 24/7 operation. This isn’t consumer hardware in a rack — it’s purpose-built infrastructure with full IPMI/iDRAC remote management.
Three Locations
Available in Frankfurt, Amsterdam, and Miami. Choose the location closest to your team, or deploy across multiple for geo-redundancy. Same hardware, same pricing, same support.
What Should You Run on This?
Based on our testing, here’s where this server delivers the most value:
| Use Case | Why This Server | Sweet Spot |
|---|---|---|
| Primary Dev/Staging Infrastructure | 128GB RAM fits dozens of Docker staging stacks, unmetered bandwidth for CI/CD | 10-50 person teams replacing cloud staging VMs |
| Primary Self-Hosted CI/CD | 8 cores for parallel builds, SSD for fast I/O, flat-rate pricing vs per-minute billing | GitHub Actions, GitLab CI, Jenkins runners |
| Strong Docker / K3s Platform | Run your entire dev platform on one box with 128GB of headroom | Internal tools, databases, caches, monitoring — all containerized |
| Strong Web Hosting Node | Unmetered bandwidth, fast SSDs, DDoS Shield for peace of mind | Agency hosting, SaaS apps, WordPress multisite |
| Strong Database Server | 128GB RAM means your working set fits in memory, 8 cores for parallel queries | PostgreSQL, MySQL, MongoDB — staging or production |
This server is equally at home as production infrastructure. The benchmarks above aren’t “just for staging” — they reflect what this hardware delivers under sustained, real-world load. The difference is that with 128GB of RAM and unmetered bandwidth at €129/month, the economics are particularly compelling for teams that are currently paying per-VM cloud prices for their development and staging environments.
The Verdict
The AMD Ryzen 7 3800X with 128GB of RAM is an infrastructure multiplier. Where cloud providers charge per VM, per GB, and per minute, this server gives you a fixed-cost platform to run dozens of staging environments, CI/CD pipelines, databases, and caches — all on a single box with unmetered bandwidth and DDoS protection included.
For teams of 10 to 50 developers spending €500-2,000/month on cloud staging resources, this server pays for itself in the first billing cycle. And unlike a cloud VM that disappears when you stop paying, this is dedicated hardware with consistent performance, no noisy neighbors, and 24/7 support from real humans.
We carry a large stock of this configuration across Frankfurt, Amsterdam, and Miami. Order today and you could be deploying your staging stacks by tomorrow.
Ready to cut your cloud development costs?
View This Server at Netrouting →
AMD Ryzen 7 3800X · 128GB DDR4 · 2×500GB SSD · 1Gbps Unmetered · DDoS Shield Included · From €129/mo
Methodology
All benchmarks were run on a freshly provisioned Ubuntu server at our Frankfurt data center with no additional services running. Tests were performed using industry-standard tools: sysbench and Geekbench 6 for CPU, fio for storage, pgbench (scale factor 50, ~750MB dataset) for PostgreSQL, redis-benchmark with pipelining for Redis, real Docker containers for stack density testing, and actual Docker builds with 15 npm dependencies for CI/CD. The WireGuard throughput test used a loopback tunnel to isolate CPU encryption performance. ISP latency was measured by pinging provider infrastructure IPs across Germany, the Netherlands, Belgium, Switzerland, Austria, France, Spain, Greece, and Italy (10 pings each, averaged).
The full benchmark script we used is available on our GitHub if you want to run it on your own Netrouting server and compare notes.
