
A monitor is a check that runs from our probe network every minute or every few minutes: does the address answer a ping, does the port accept a connection, does the website return a good response. When a check fails you get an email, and a push notification on your phone if you want one. When it recovers you get told that too. Monitors are free and take a minute to set up.
What can be checked
| Type | What passes | Use it for |
|---|---|---|
| PING | The address answers ICMP echo. | Is the machine on the network at all. |
| TCP | A connection to the port opens. | SSH, SMTP, a database port, a game server port. |
| HTTP | A request to port 80 gets a successful response. | A plain website or a health endpoint. |
| HTTPS | A request to port 443 gets a successful response over TLS. | Almost every website. |
Checks run against the server's own addresses. Every monitor belongs to one of your servers or instances and targets one of its public IPv4 addresses; a hostname on somebody else's infrastructure cannot be monitored from here. The interval is from one minute to a day; one and five minutes are the common choices. Each server can carry up to ten monitors, and an account up to fifty.
Method 1: In the portal
- Log in at amoni.app and open Monitoring under Network in the left-hand menu.
- Click New Monitor.
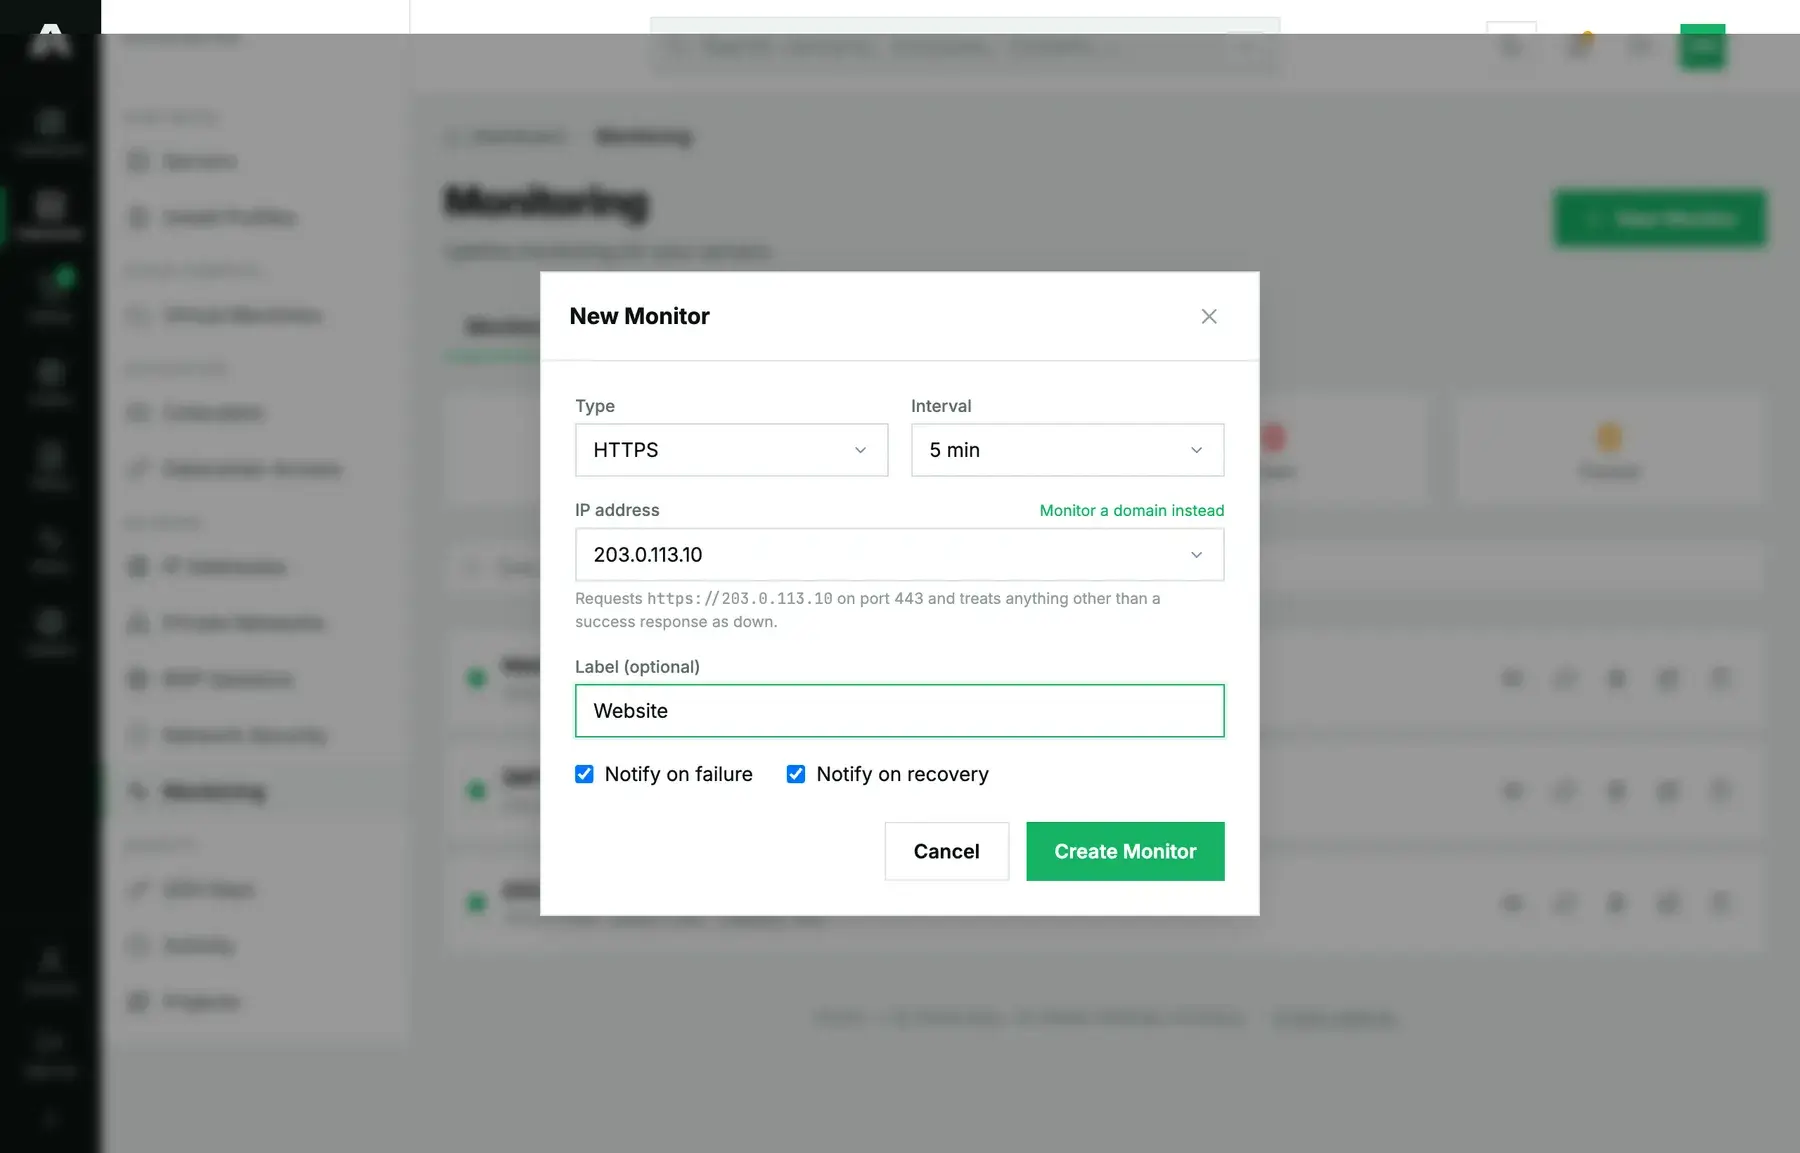
- Choose the type, then the address from your own IPs (the picker lists them with the server they belong to). For a TCP check enter the port.
- Set the interval and give the monitor a label so the alert email says “Website” rather than an address.
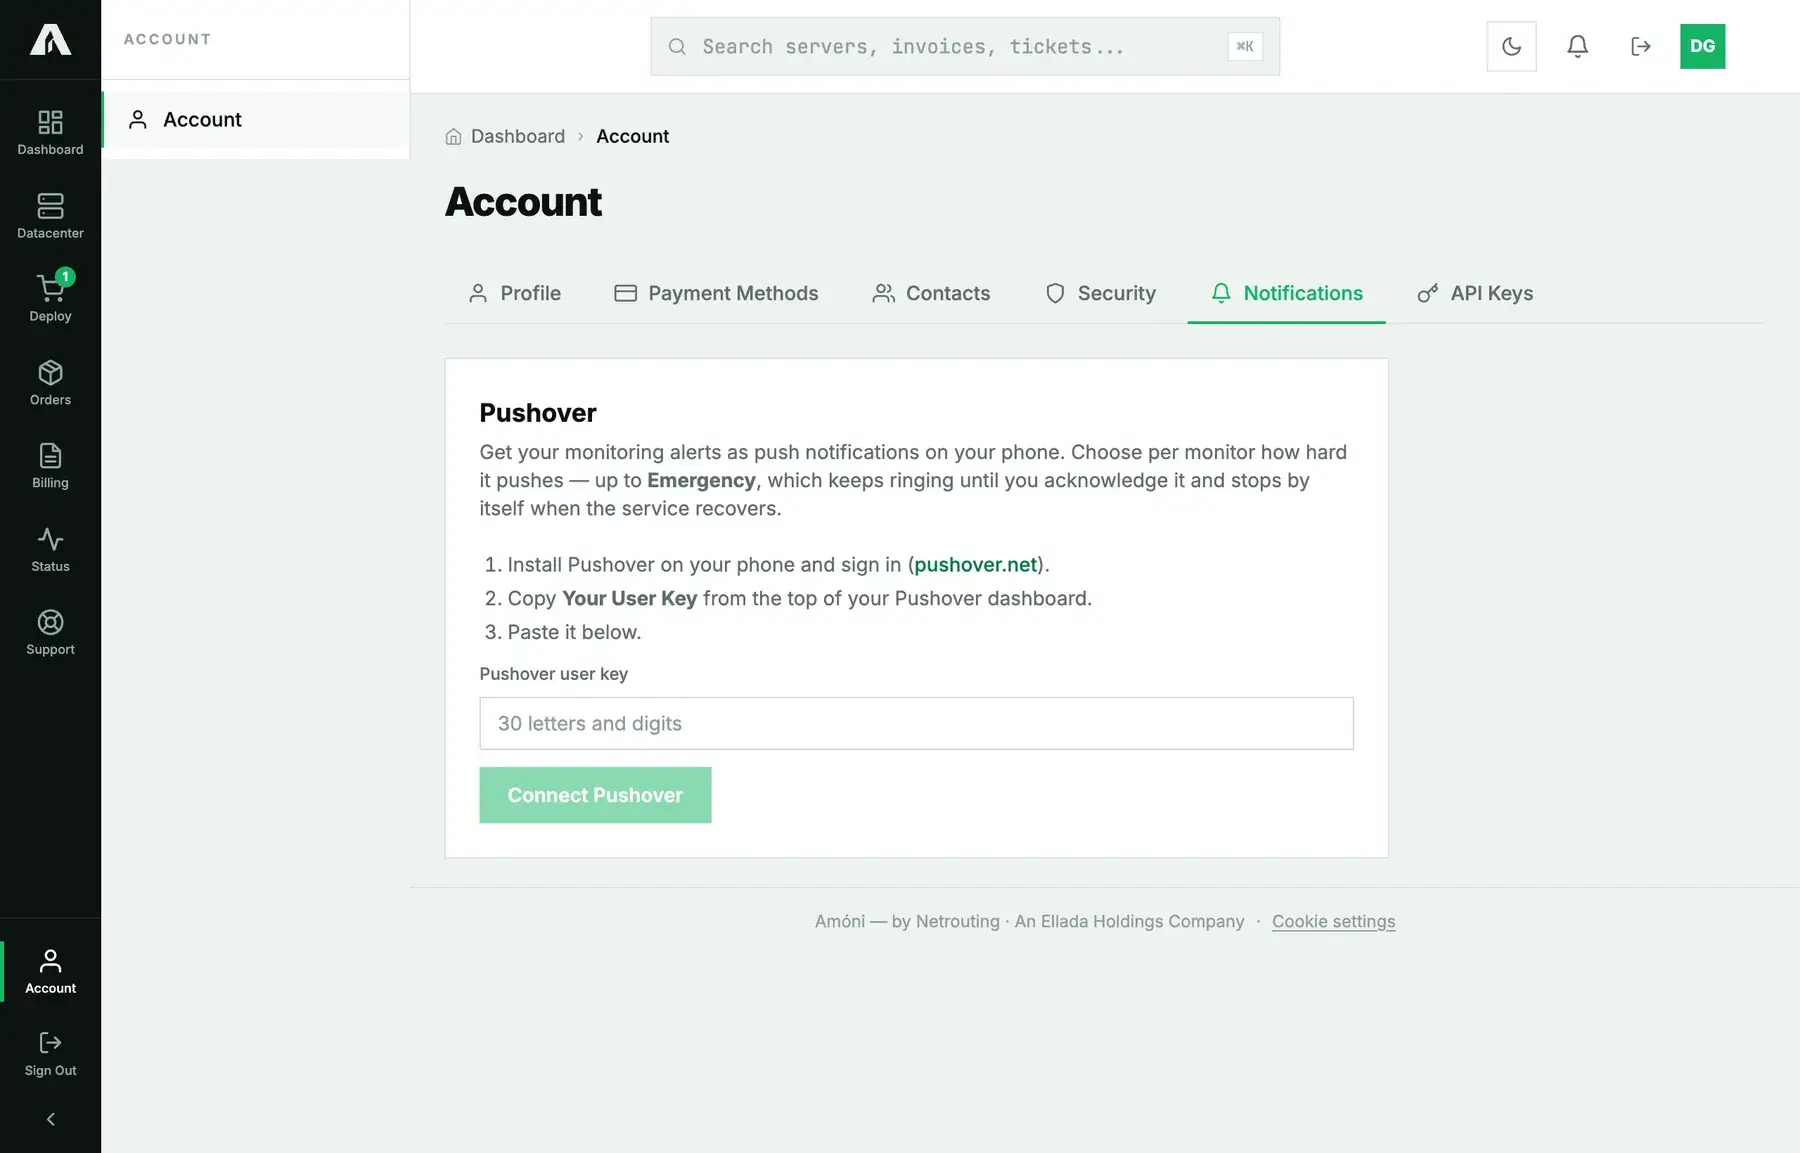
- Choose the alerts: an email on failed checks, an email when it is back, and optionally a Pushover notification at normal, high or emergency priority. Emergency rings every minute until you acknowledge it. Pushover needs your user key under Account → Notifications first.
- Click Create Monitor. The first check runs within the chosen interval.
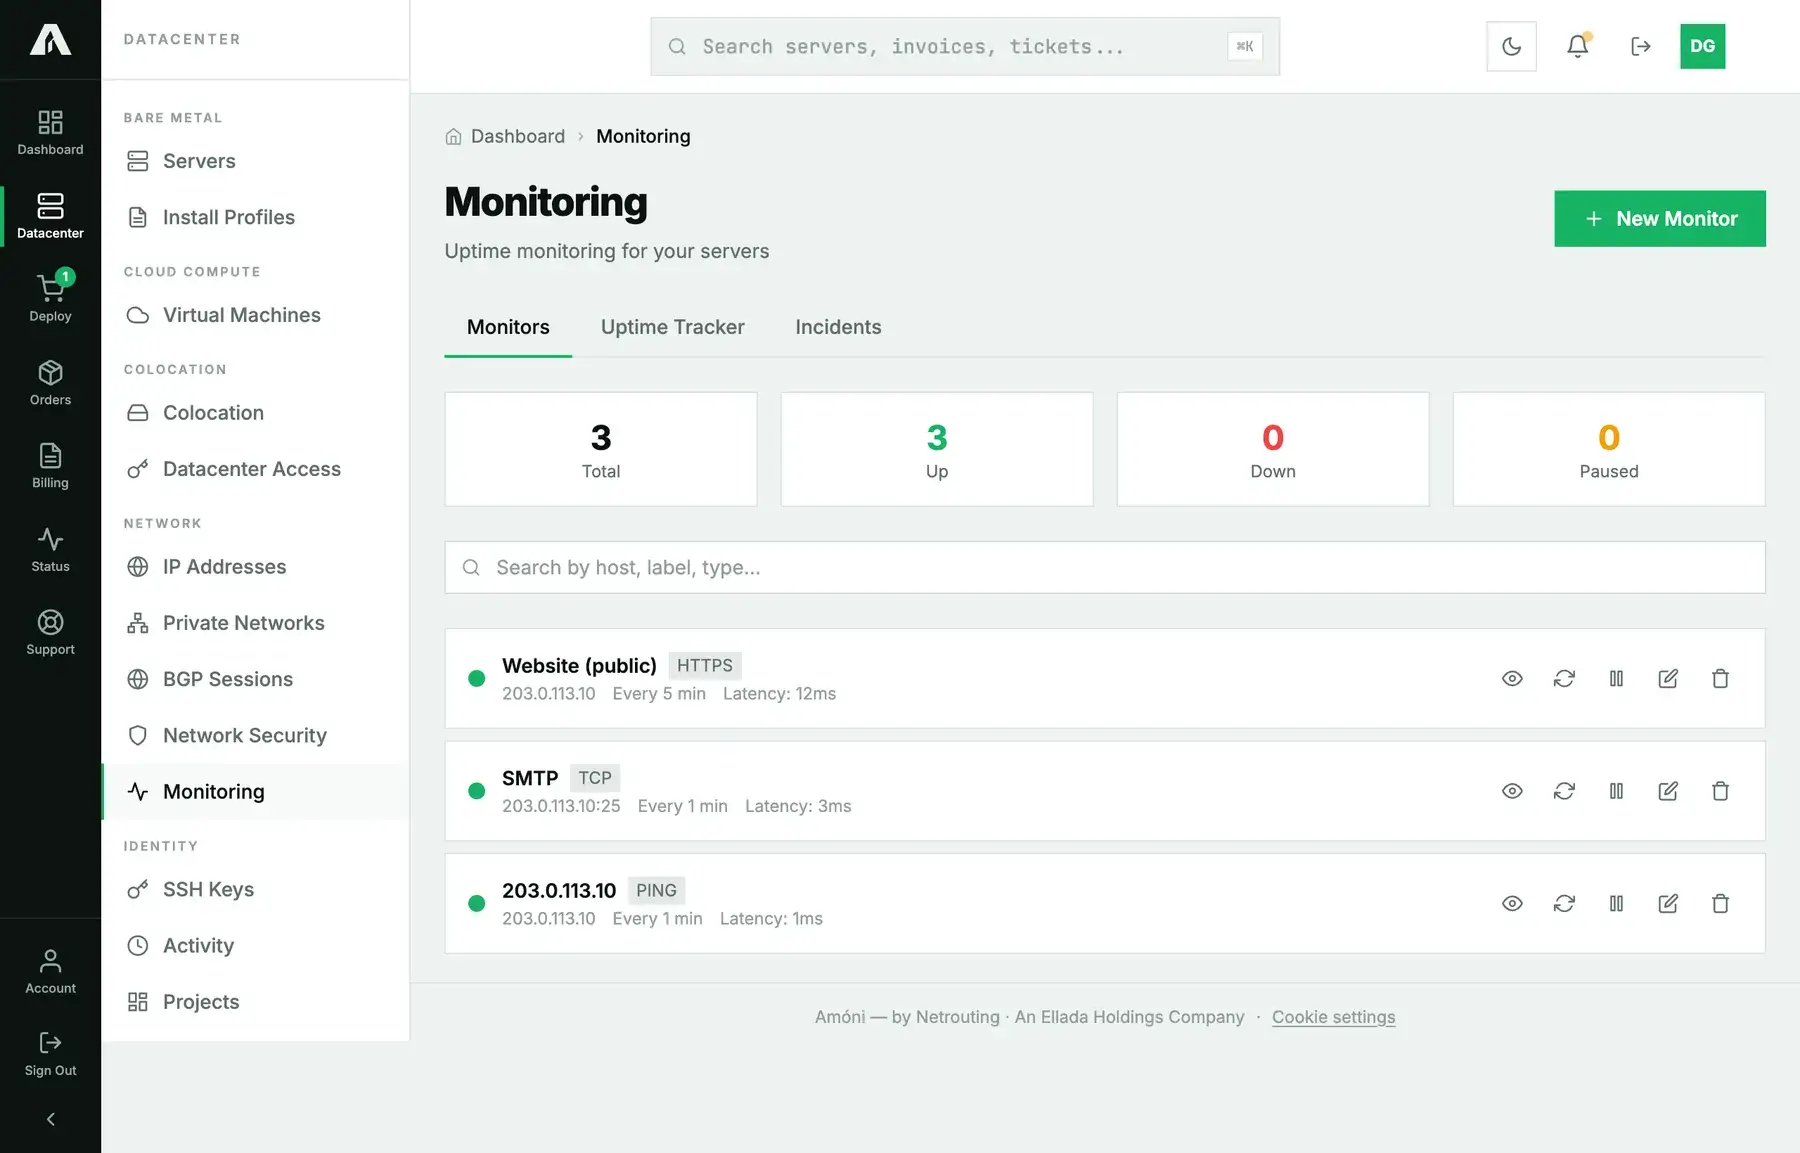
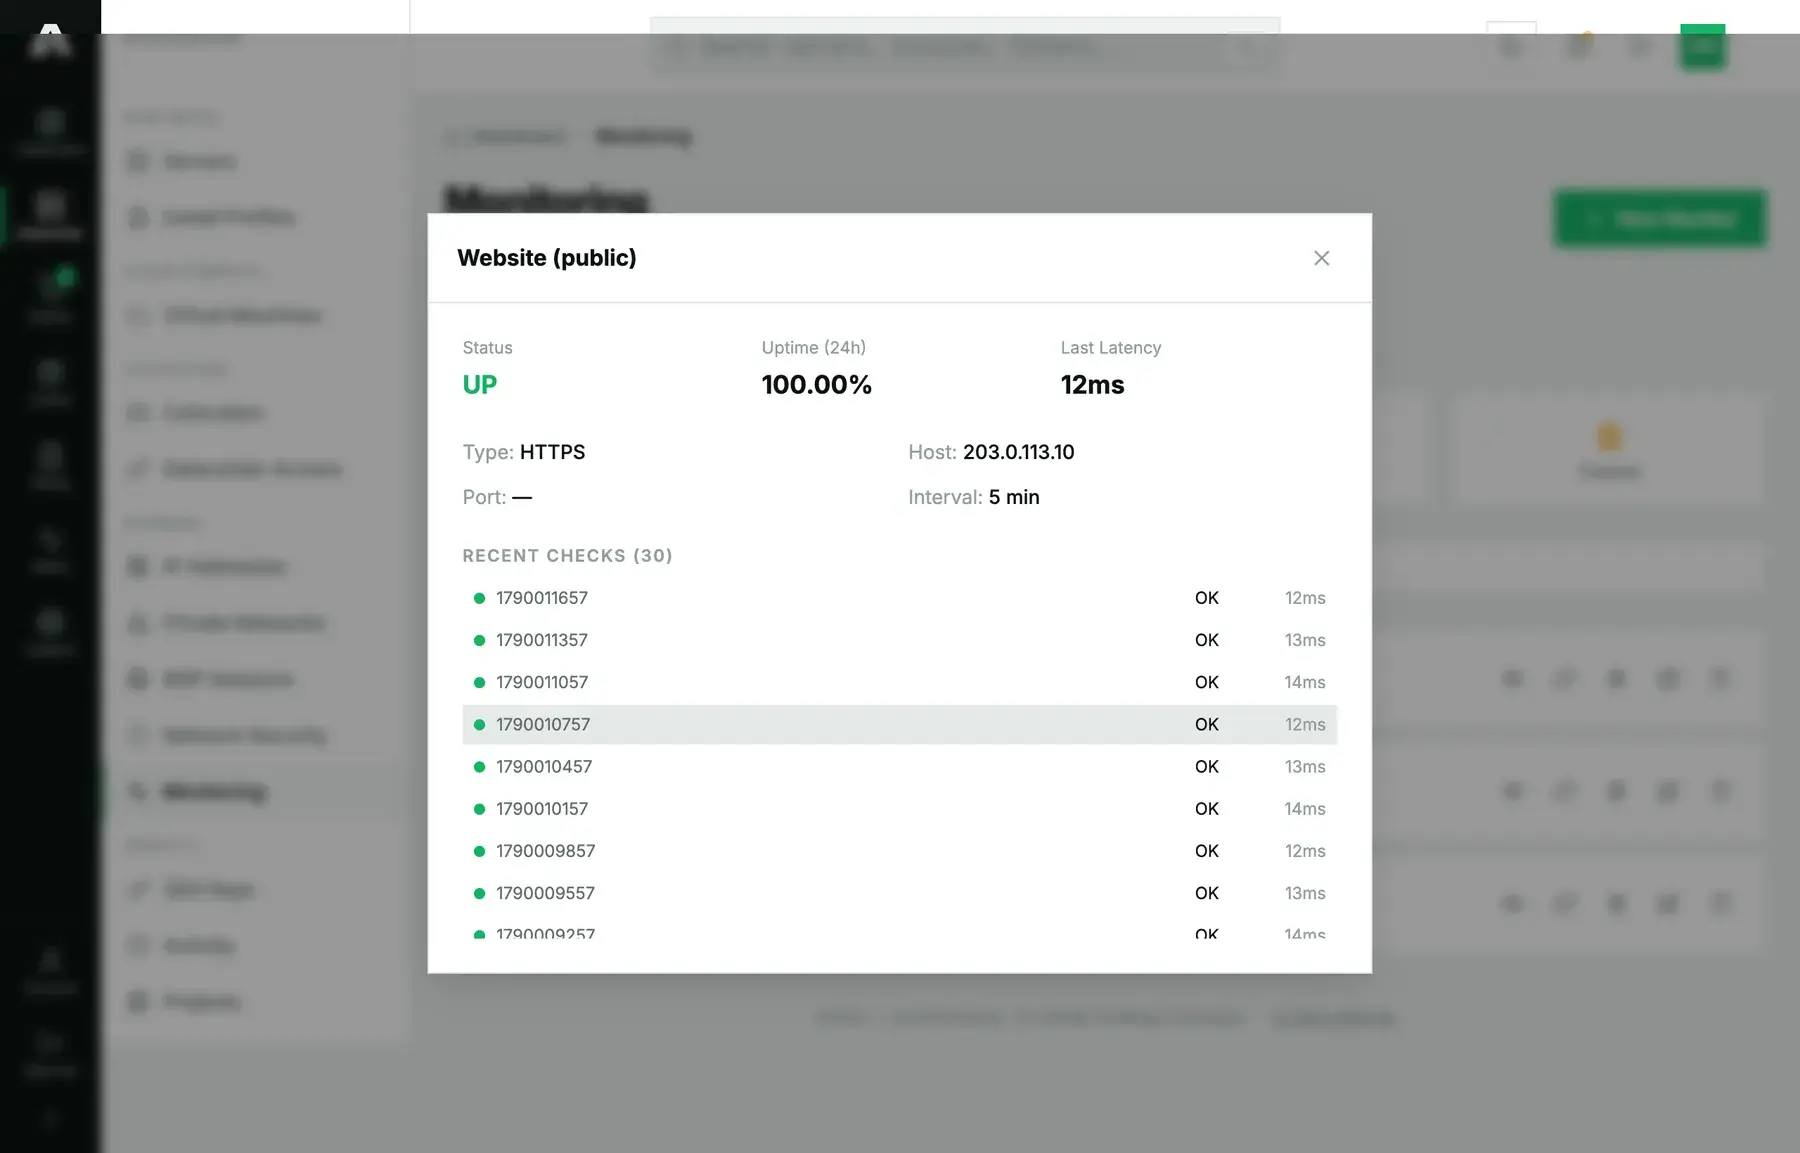
Each row has four controls: view opens the detail with the recent latency, the Uptime Tracker percentages and the Incidents list; run now triggers a check outside the schedule; pause stops the checks and the alerts without deleting the history (useful during maintenance); edit changes the label, the interval and the alerts. The type and the address of a monitor cannot be changed, because the history would no longer mean anything; create a new one instead. Deleting a monitor deletes its history.
Method 2: With the API
You need a key with the Monitoring scope (monitors.write) to create, change or delete; read is enough to list and to read uptime and incidents. Reference: api.amoni.app/v1/docs.
1. Create. server_id is the numeric id from /v1/servers; host must be one of that server's addresses; type is ping, tcp, http or https; port is required for tcp; interval is in seconds (60 to 86400, default 300).
curl -s -X POST https://api.amoni.app/v1/monitors \
  -H "Authorization: Bearer nr_live_..." \
  -H "Content-Type: application/json" \
  -d '{"server_id": 955, "type": "https", "host": "203.0.113.10", "interval": 300,
       "label": "Website", "notify_failed_checks": true, "notify_back_online": true}'
{ "success": true, "data": { "id": 17, "message": "Monitor created." } }A TCP check needs the port: {"server_id": 955, "type": "tcp", "host": "203.0.113.10", "port": 25, "interval": 60, "label": "SMTP"}.
2. List and read.
curl -s https://api.amoni.app/v1/monitors -H "Authorization: Bearer nr_live_..."{
"success": true,
"data": [
{
"id": 17, "server_id": 955, "type": "HTTPS", "host": "203.0.113.10", "port": 0,
"interval": 300, "label": "Website", "paused": false,
"notify_failed_checks": 1, "notify_back_online": 1, "notify_pushover": false, "pushover_priority": 1,
"latest_result": null
}
]
}latest_result carries success, latency in milliseconds and checked_at once a check has run. GET /v1/monitors/{id} adds the recent results, GET /v1/monitors/{id}/uptime the percentages per day for the week, and GET /v1/monitors/{id}/incidents the outages with start, end and duration:
{ "success": true, "data": { "period": "week", "checks": 0, "uptime_pct": null, "avg_latency_ms": null, "covered_from": null, "days": [] } }3. Pause, resume, run now, change, delete.
curl -s -X POST https://api.amoni.app/v1/monitors/17/pause \
  -H "Authorization: Bearer nr_live_..." -H "Content-Type: application/json" -d '{"paused": true}'
# { "success": true, "data": { "paused": true, "message": "Monitor paused." } }

curl -s https://api.amoni.app/v1/monitors/17/check -H "Authorization: Bearer nr_live_..."
# { "success": true, "data": { "results": [ ... ] } }

curl -s -X PUT https://api.amoni.app/v1/monitors/17 \
  -H "Authorization: Bearer nr_live_..." -H "Content-Type: application/json" \
  -d '{"label": "Website (public)", "notify_back_online": false}'
# { "success": true, "data": { "message": "Monitor updated." } }

curl -s -X DELETE https://api.amoni.app/v1/monitors/17 -H "Authorization: Bearer nr_live_..."
What the API will tell you
| Status | code |
Meaning |
|---|---|---|
| 201 | none | Created; data.id is the monitor. |
| 400 | limit_reached |
Ten monitors on that server, or fifty on the account. Delete one first. |
| 403 | insufficient_scope |
The key lacks monitors.write. |
| 404 | server_not_found / monitor_not_found |
Not on your account. |
| 422 | invalid_host |
“Monitoring is limited to the server's own IP addresses.” |
| 422 | immutable_field |
You tried to change the host or the type. Create a new monitor. |
| 422 | no_pushover_key |
Pushover alerts were requested but no user key is stored under Account → Notifications. |
| 422 | none | A field failed validation (a TCP check without a port, an unknown type). Framework shape: {"message": "The port field is required.", "errors": {…}}. |
Reading the results
The Uptime Tracker tab shows each monitor's uptime per day for the past week, and the detail view shows the 24-hour figure with the latest latency. The Incidents tab lists every outage with its start, end and duration, and why the check failed (a timeout, a refused connection, a bad HTTP status). An incident starts at the first failed check and ends at the first successful one, so a one-minute check gives you outage lengths to the minute; a fifteen-minute check does not.
Questions we get
- Can I monitor my domain name? Only through the address it points to, on a server of yours. The check reports on that address; a DNS mistake on your side would not show.
- Why did I get an alert when the site was fine? A single failed check is enough to alert. If you see false alarms on a busy server, lengthen the interval or check a lighter endpoint than the home page.
- Can I be alerted by webhook instead? Webhooks for monitor events exist on the API; see the webhooks section of the reference. Pushover and email are the built-in channels.
- Do the checks use my bandwidth? A negligible amount: a ping or a small HTTP request every minute.
- Can a colleague get the alerts too? Alerts go to the account email and to the Pushover key on the account. Give the colleague their own login and Pushover key, or forward the emails.
- What about an attack rather than an outage? A monitor tells you the service stopped answering, not why. If the Graphs tab shows a flood, read DDoS protection and blackholing.
Still stuck?
Open a support ticket with the monitor's label and the time of the alert. We can see the same check results from our side.