
A monitor is a check our probe network runs every minute or every few minutes: does the address answer a ping, does the port accept a connection, does the website come back with a good response. If a check fails you get an email, plus a push notification on your phone if you want one, and you hear about the recovery too. Monitors cost nothing and take a minute to set up.
What can be checked
| Type | What passes | Use it for |
|---|---|---|
| PING | The address answers ICMP echo. | Whether the machine is on the network at all. |
| TCP | A connection to the port opens. | SSH, SMTP, a database port, a game server port. |
| HTTP | A request to port 80 gets a successful response. | A plain website or a health endpoint. |
| HTTPS | A request to port 443 gets a successful response over TLS. | Almost every website. |
Checks only run against the server's own addresses. Every monitor belongs to one of your servers or instances and targets one of its public IPv4 addresses, so a hostname on somebody else's infrastructure can't be monitored from here. Intervals go from one minute to a day, and most people pick one or five minutes. A server can carry up to ten monitors, an account up to fifty.
Method 1: In the portal
- Log in at amoni.app and open Monitoring (under Network in the left-hand menu).
- Click New Monitor.
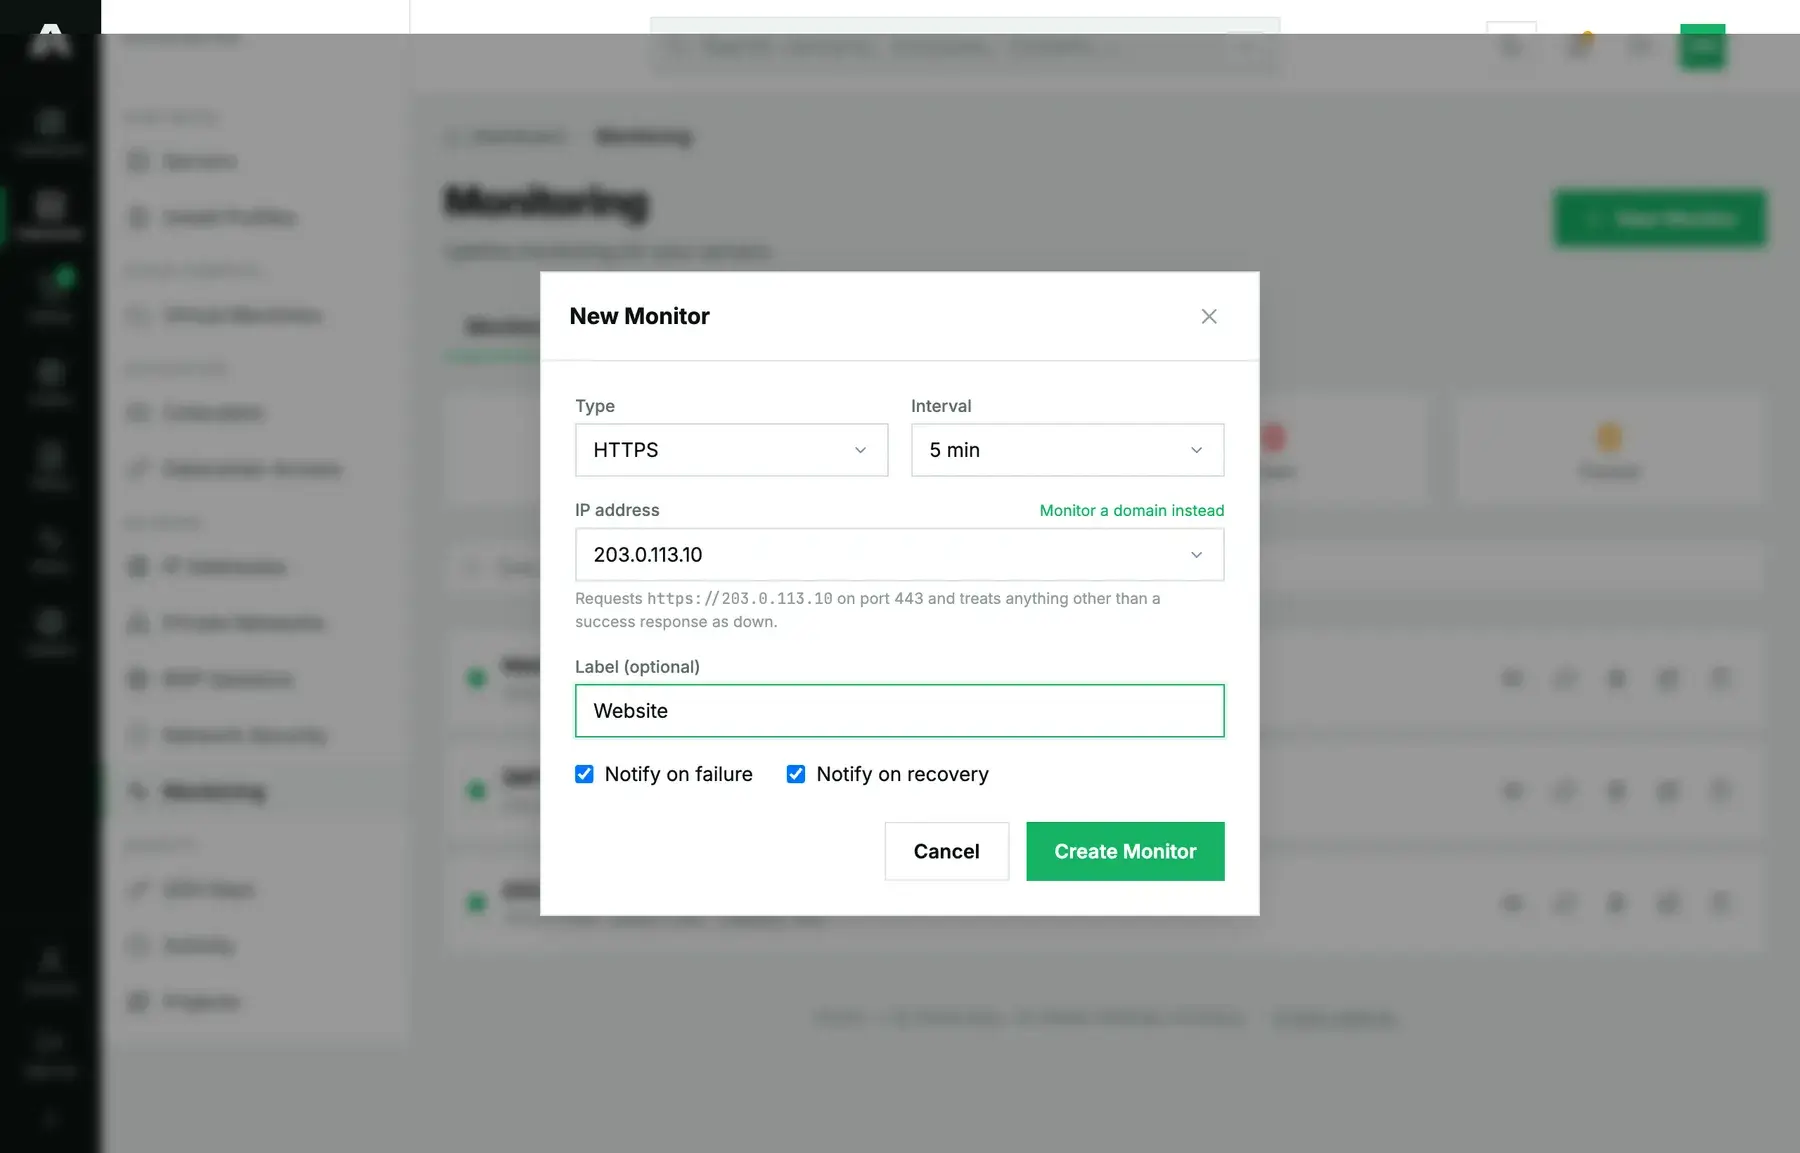
- Choose the type, then the address from your own IPs; the picker shows each one with the server it belongs to. A TCP check also needs the port.
- Set the interval, then give the monitor a label, so the alert email reads “Website” and not a bare address.
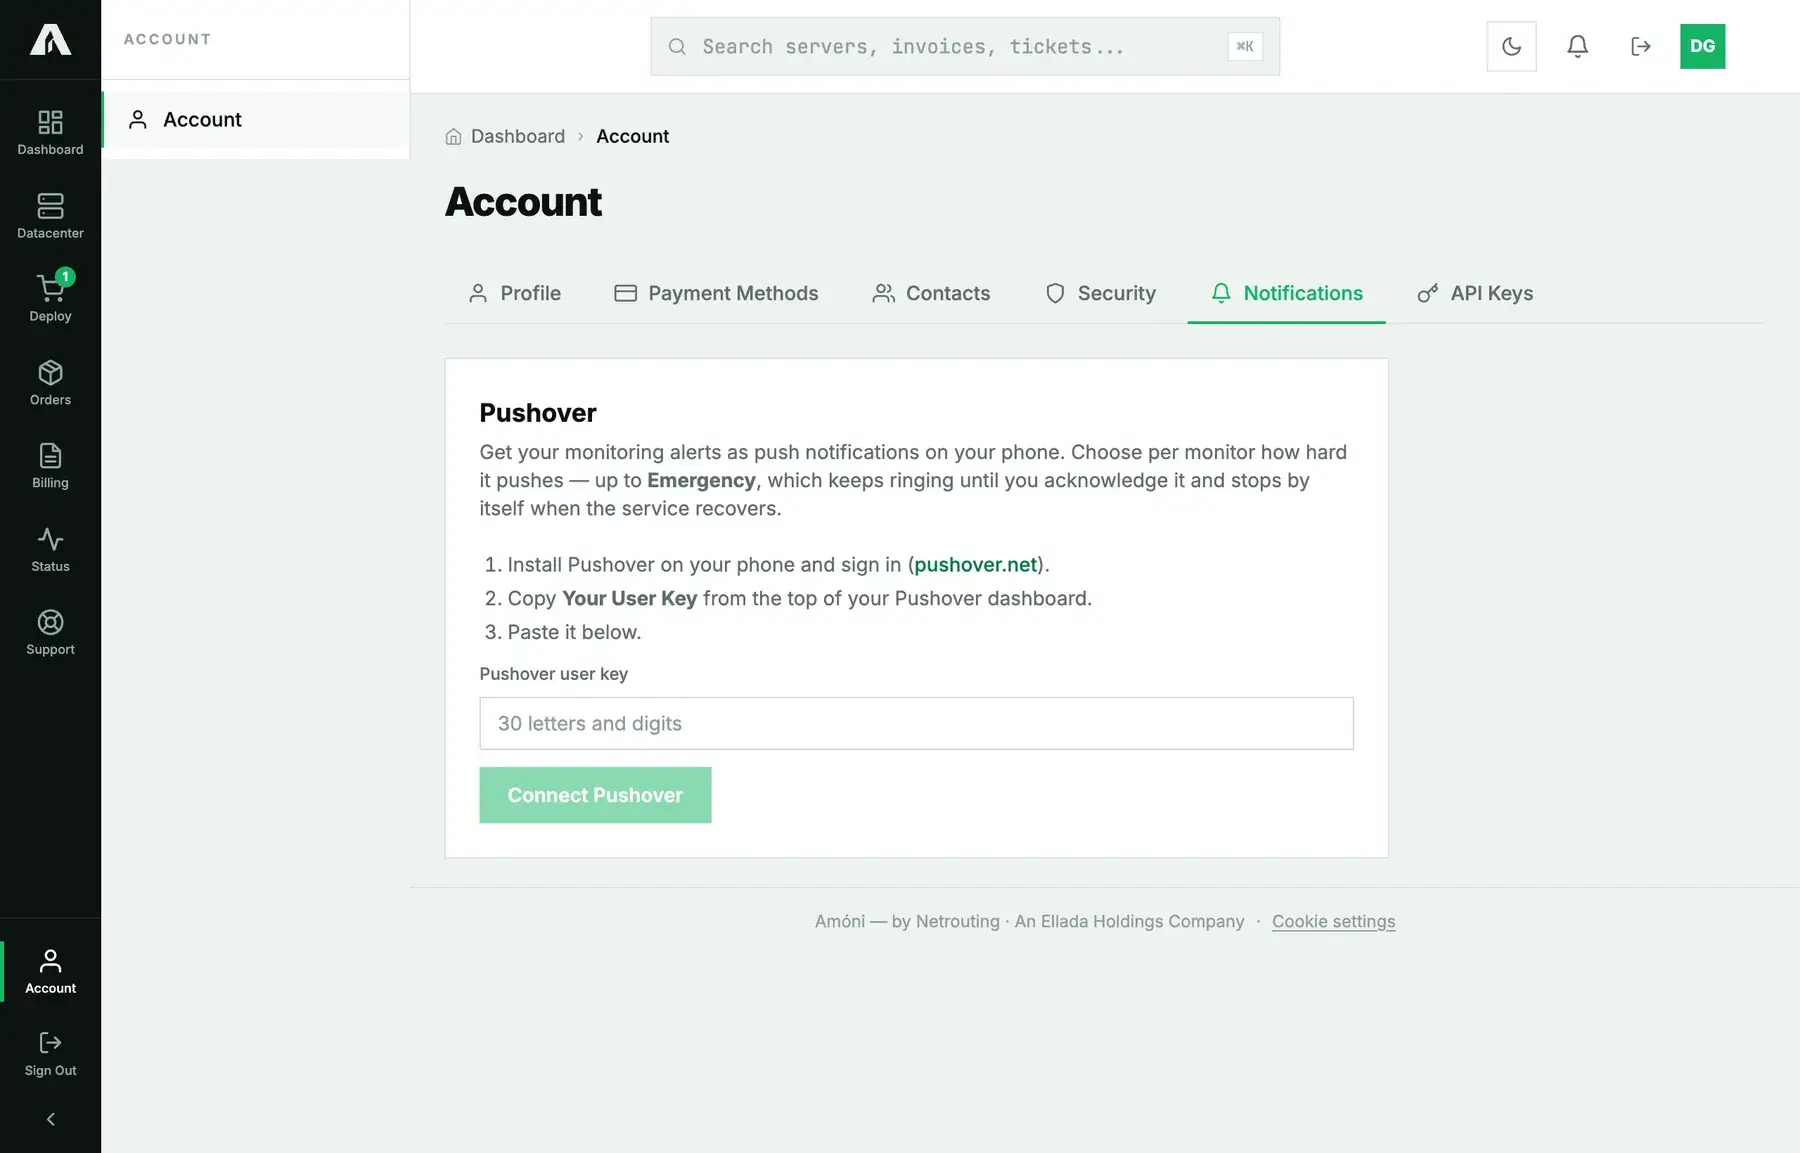
- Pick the alerts: an email on failed checks, an email when it's back, and if you like a Pushover notification at normal, high or emergency priority. Emergency keeps ringing every minute until you acknowledge it. For Pushover, your user key has to be saved under Account → Notifications first.
- Click Create Monitor. The first check runs within the interval you chose.
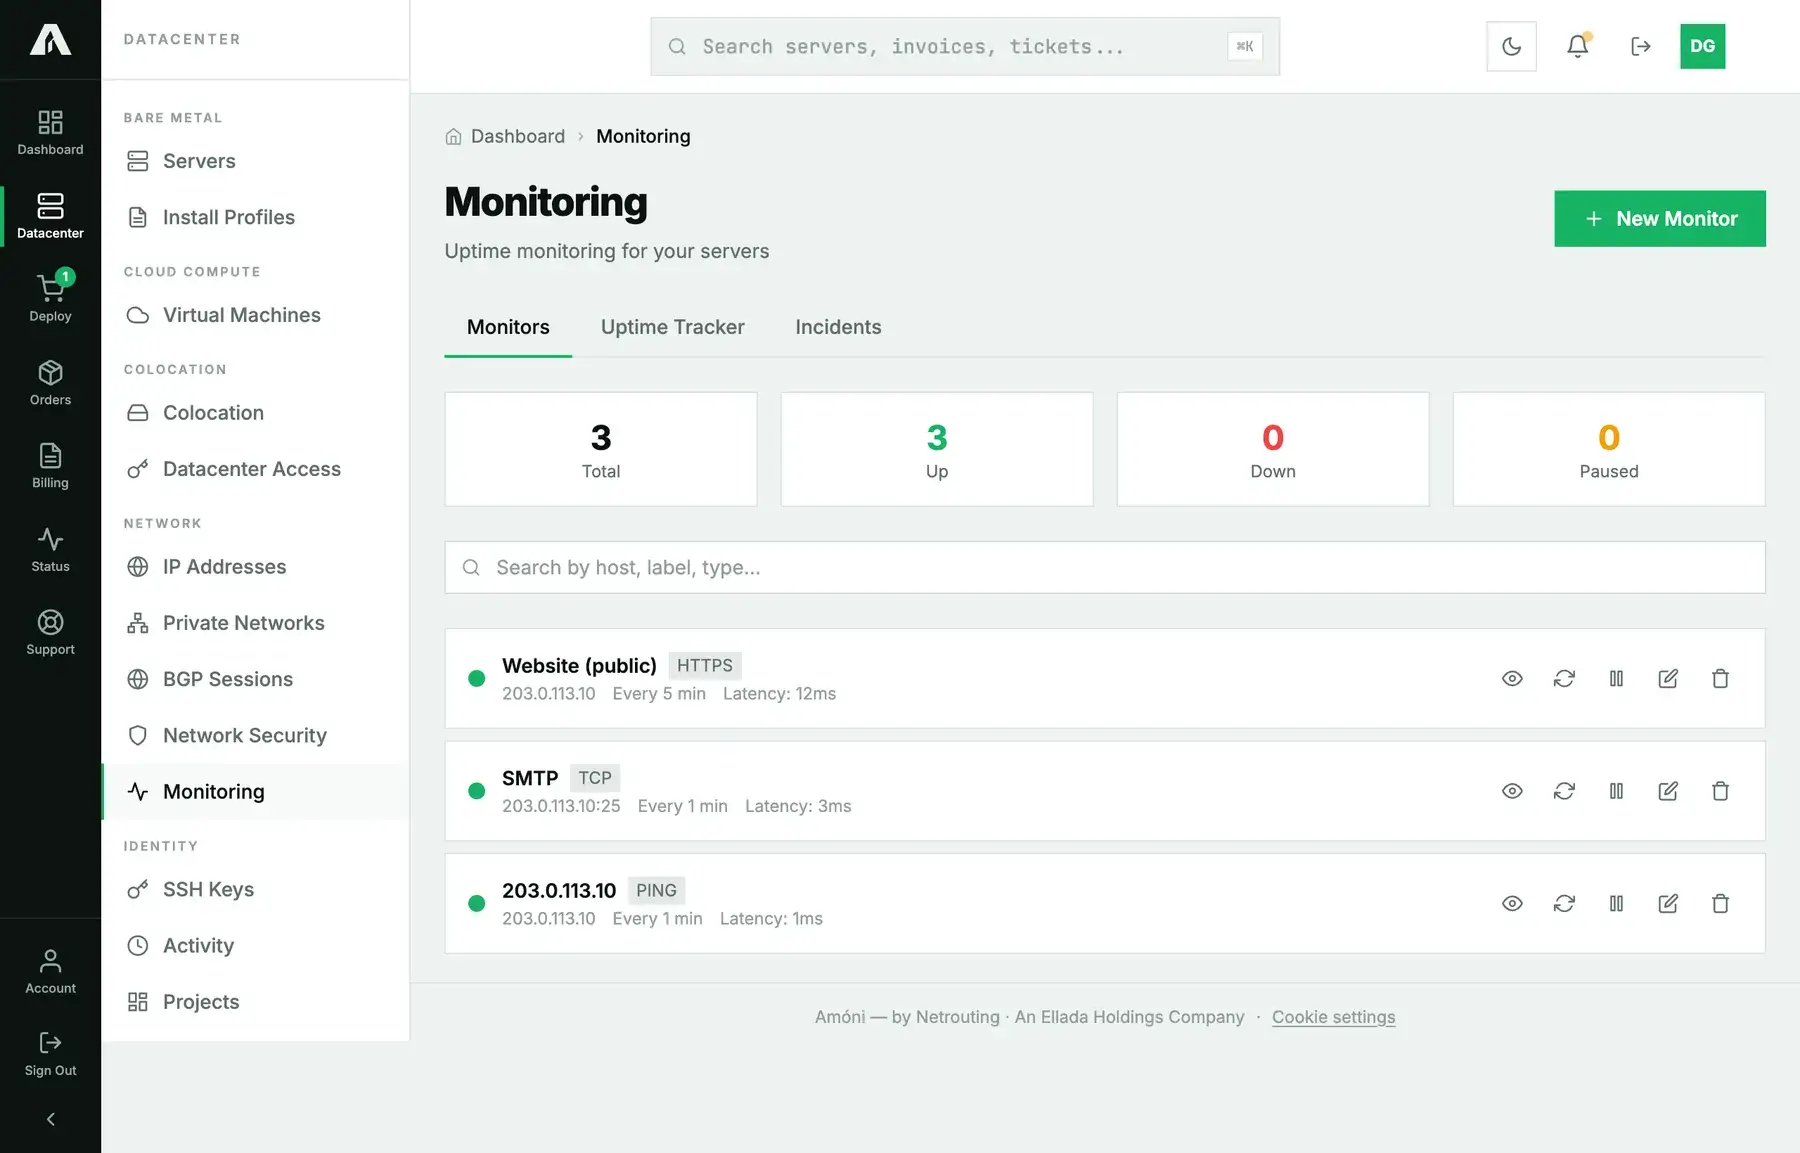
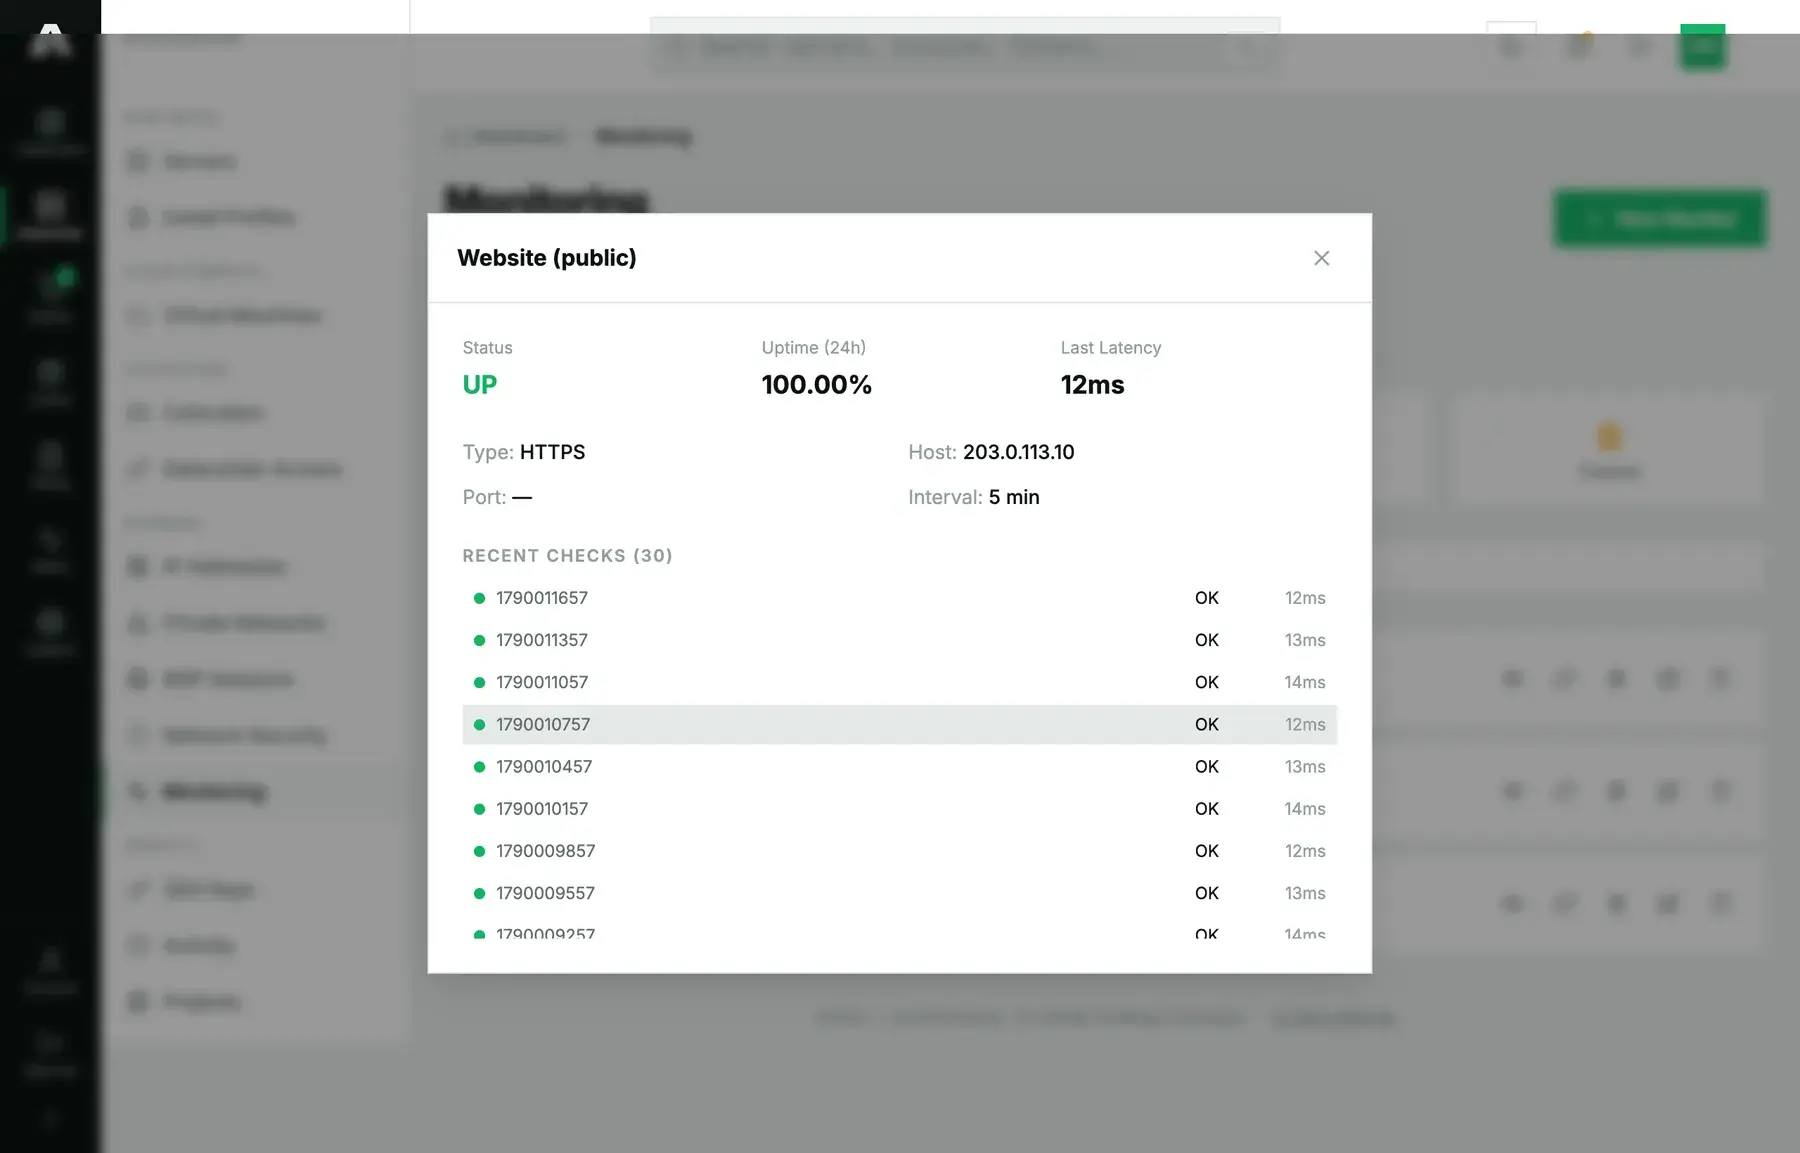
Every row has four controls: view opens the detail view with recent latency, the Uptime Tracker percentages and the Incidents list; run now fires a check off-schedule; pause stops checks and alerts but keeps the history (handy during maintenance); edit changes the label, the interval and the alerts. You can't change a monitor's type or address, since its history would stop meaning anything; create a new monitor instead. Deleting a monitor deletes its history too.
Method 2: With the API
You need a key with the Monitoring scope (monitors.write) to create, change or delete monitors, while read covers listing them and reading uptime and incidents. Reference: api.amoni.app/v1/docs.
1. Create. server_id is the numeric id from /v1/servers; host has to be one of that server's addresses; type is ping, tcp, http or https; port is required for tcp; interval is given in seconds (60 to 86400, default 300).
curl -s -X POST https://api.amoni.app/v1/monitors \
  -H "Authorization: Bearer nr_live_..." \
  -H "Content-Type: application/json" \
  -d '{"server_id": 955, "type": "https", "host": "203.0.113.10", "interval": 300,
       "label": "Website", "notify_failed_checks": true, "notify_back_online": true}'
{ "success": true, "data": { "id": 17, "message": "Monitor created." } }For a TCP check, include the port: {"server_id": 955, "type": "tcp", "host": "203.0.113.10", "port": 25, "interval": 60, "label": "SMTP"}.
2. List and read.
curl -s https://api.amoni.app/v1/monitors -H "Authorization: Bearer nr_live_..."{
"success": true,
"data": [
{
"id": 17, "server_id": 955, "type": "HTTPS", "host": "203.0.113.10", "port": 0,
"interval": 300, "label": "Website", "paused": false,
"notify_failed_checks": 1, "notify_back_online": 1, "notify_pushover": false, "pushover_priority": 1,
"latest_result": null
}
]
}latest_result carries success, latency in milliseconds and checked_at as soon as a check has run. GET /v1/monitors/{id} adds the recent results, GET /v1/monitors/{id}/uptime returns the per-day percentages for the week, and GET /v1/monitors/{id}/incidents lists the outages with their start, end and duration:
{ "success": true, "data": { "period": "week", "checks": 0, "uptime_pct": null, "avg_latency_ms": null, "covered_from": null, "days": [] } }3. Pause, resume, run now, change, delete.
curl -s -X POST https://api.amoni.app/v1/monitors/17/pause \
  -H "Authorization: Bearer nr_live_..." -H "Content-Type: application/json" -d '{"paused": true}'
# { "success": true, "data": { "paused": true, "message": "Monitor paused." } }

curl -s https://api.amoni.app/v1/monitors/17/check -H "Authorization: Bearer nr_live_..."
# { "success": true, "data": { "results": [ ... ] } }

curl -s -X PUT https://api.amoni.app/v1/monitors/17 \
  -H "Authorization: Bearer nr_live_..." -H "Content-Type: application/json" \
  -d '{"label": "Website (public)", "notify_back_online": false}'
# { "success": true, "data": { "message": "Monitor updated." } }

curl -s -X DELETE https://api.amoni.app/v1/monitors/17 -H "Authorization: Bearer nr_live_..."
What the API will tell you
| Status | code |
Meaning |
|---|---|---|
| 201 | none | Created, and data.id is the new monitor. |
| 400 | limit_reached |
That server already has ten monitors, or the account has fifty. Delete one first. |
| 403 | insufficient_scope |
The key doesn't have monitors.write. |
| 404 | server_not_found / monitor_not_found |
Not on your account. |
| 422 | invalid_host |
“Monitoring is limited to the server's own IP addresses.” |
| 422 | immutable_field |
You tried to change the host or the type; create a new monitor instead. |
| 422 | no_pushover_key |
You asked for Pushover alerts, but there's no user key stored under Account → Notifications. |
| 422 | none | A field failed validation, such as a TCP check with no port or an unknown type. Framework shape: {"message": "The port field is required.", "errors": {…}}. |
Reading the results
The Uptime Tracker tab shows each monitor's daily uptime over the past week; the detail view has the 24-hour figure and the latest latency. The Incidents tab lists every outage with its start, end and duration, and why the check failed: a timeout, a refused connection, a bad HTTP status. An incident opens at the first failed check and closes at the first successful one. That's why a one-minute check gives you outage lengths to the minute and a fifteen-minute check can't.
Questions we get
- Can I monitor my domain name? Only through the address it points to, and that has to be on one of your servers. The check reports on the address, so a DNS mistake on your side wouldn't show up.
- Why did I get an alert when the site was fine? One failed check is enough to trigger an alert. If a busy server gives you false alarms, lengthen the interval, or point the check at a lighter endpoint than the home page.
- Can I be alerted by webhook instead? The API has webhooks for monitor events; the webhooks section of the reference covers them. Email and Pushover are the built-in channels.
- Do the checks use my bandwidth? The amount is negligible: a ping or a small HTTP request every minute.
- Can a colleague get the alerts too? Alerts go to the account's email address and the account's Pushover key. Either give the colleague a login and Pushover key of their own, or forward the emails.
- What about an attack rather than an outage? A monitor tells you that the service stopped answering, not why it did. If the Graphs tab shows a flood, read DDoS protection and blackholing.
Still stuck?
Open a support ticket with the monitor's label and the time of the alert. We see the same check results on our side.